
What the members said
 3:03:10
Homelessness
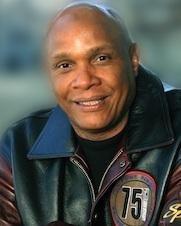
Those that were against, you know, everybody can be judgmental. Nobody wanted it in their neighborhood, right? You know, anybody could wind up homeless, but some people wouldn’t want that.Willie AdamsCommissioner · Port Commission · Nov 18, 2025Open the meeting at 3:03:10
 23:31
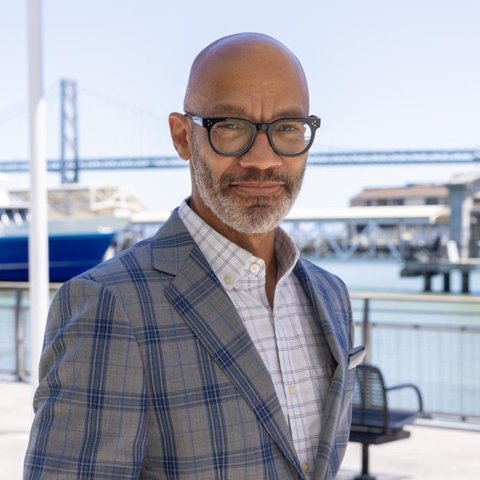
The port and the staff does a great job with community outreach. You always seem to have your finger on the pulse of the community, and the work that you were doing and you mentioned around the cruise terminal and some of the outreach with the community has always been fantastic.
Ken McNeelyCommissioner · Port Commission · May 12, 2026Open the meeting at 23:31
Willie Adams talks the most on the Port Commission: at least 8.8 minutes a meeting (preliminary)
Preliminary: at least 62% of members’ talk time is identified, under the 80% for a full comparison. No other member’s rank range reaches first place. Members we compare average 1.3 to 8.8 minutes a meeting.
Latest meetings
- Nov 251
- Dec 251
- Jan 262
- Feb 262
- Mar 261
- Apr 262
- May 261
- Jun 262
- Jul 261
- Aug 261
- Sep 261
- Oct 261
15 of 16 meetings transcribed, Oct 24, 2025 to Oct 23, 2026.Newest: Oct 20, 2026
Sep 15 · Informational presentation with possible action to increase the Port's sole-source grant to the Fisherman's Wharf Community Benefits District not-to-exceed amount by $1,953,902 and extend the term by 12 months took 28 minThe longest item after routine business: Informational presentation with possible action to increase the Port's sole-source…, 28 min of this 3 h 08 min meeting.Speakers: Stephen Engblom, Willie Adams, Ken McNeely, Vanessa Tapia Hartigan and 1 more
Longest item: 14% of the meeting18 agenda itemsWatch
Aug 11 · Commission meetingThe executive director's report was given, including an acknowledgement of the Commission's newest member.Speakers: Willie Adams, Stephen Engblom, Ken McNeely, Vanessa Tapia Hartigan
Watch
Jul 14 · Approve a nine-month extension to the Lease Disposition and Development Agreement (the LDDA) with TZK Broadway, LLC took 34 minThe longest item after routine business: Approve a nine-month extension to the Lease Disposition and Development Agreement (the…, 34 min of this 2 h 57 min meeting.Speakers: Stephen Engblom, Willie Adams, Ken McNeely
Longest item: 19% of the meeting13 agenda itemsWatch
Jun 23 · Commission meetingThe minutes from the June 9th meeting were announced as passed after a motion and a second.
4 agenda itemsWatch
One more meeting is not transcribed yet.
Listed after the newest meeting above, not transcribed yet (video listings through Oct 23): 1
Coming upNothing posted on city calendars as of Oct 29. Some boards post elsewhere. RSS feed
No topic dominates: the largest, business and economic development, took 11% of checked time
Share of meeting time by topic, from the clerk’s agenda times · 15 meetings, 42 hours · Oct 24, 2025 – Oct 23, 2026, the clerk’s times also cover meetings not yet transcribed
Business and economic development11%
Development and land use3.9%
Budget and spending3.9%
Homelessness2.5%
bar = share of meeting time · line = 90% range · tick = typical San Francisco body (shown where it is 0.5% or more)
Four public speakers a meeting; the biggest crowd, 15, came on Jul 14, 2026
Jul 14, 2026The Commission took up Item 9A, the election of Port Commission officers, and nominations were made for President and Vice President.
bar = public speakers at that meeting · tick = average meeting